Functional sample comparison
tools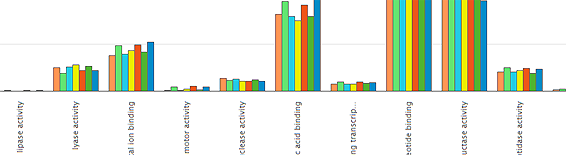 Interested in comparing the functional profile of sequencing runs within a project? Now it is possible, using our comparison tool, which provides analysis based on a slimmed-down subset of Gene Ontology (GO) terms, specially developed to describe metagenomic data.
You can visualise the results using a range of interactive charts (bar charts, stacked columns, Principal Component Analysis and heatmaps). The different charts can be exported in PNG, PDF and SVG formats, so that they can easily be included in presentations and publications.
Written on